Jamie Larsson
Hi! I'm an Environmental and GIS Scientist with background in field assessments of streams and wetlands, producing cartography for clients, GIS administration, and advanced spatial analysis including modelling with machine learning. I have experience using ArcGIS, QGIS, PostGIS, ENVI, R, and Python, and am interested in spatial modeling, stream/wetland ecology & conservation, and landscape-scale change from ecological disturbances.

Resumé
GIS Portfolio:
Field packet map for Clean Streams, 2025
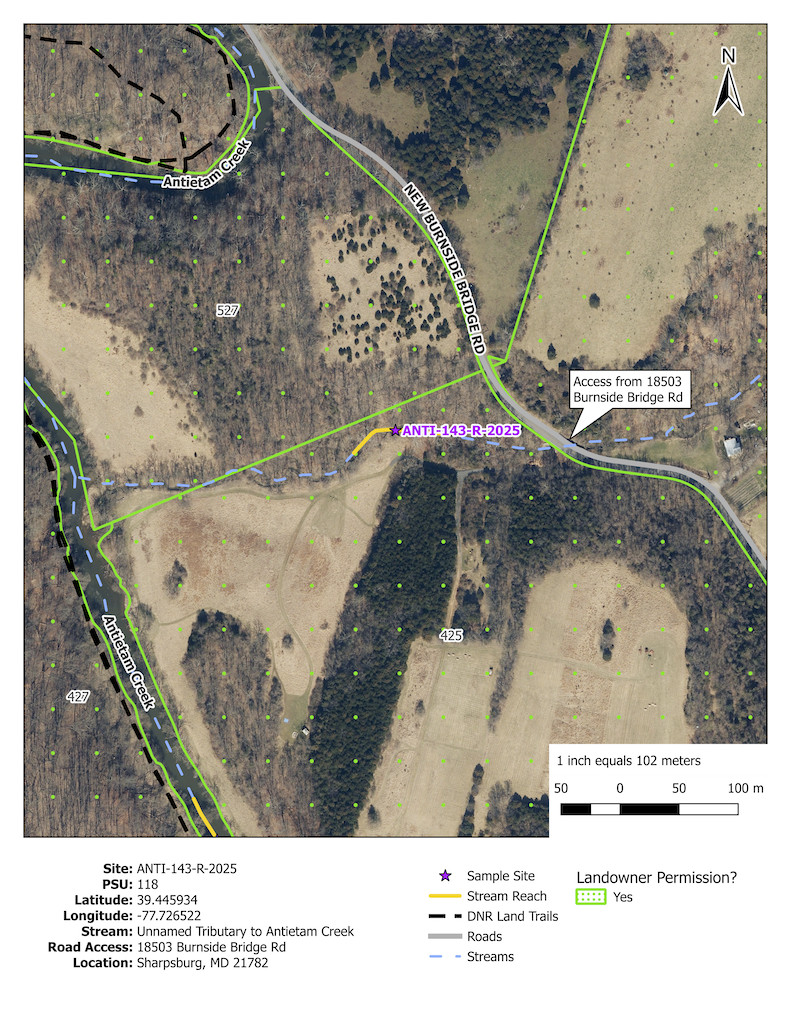
This is one page from a field packet I created while working at Clean Streams on a contract for Maryland DNR's Maryland Biological Stream Survey. This was one of approximately 200 field packet maps that I and one other teammate worked together to create, and was the final result of a process which consisted of 1) Using a statewide parcels geodatabase from Maryland SDAT to identify landowner permissions needed by DNR's scientists to carry out their surveys, 2) Contacting each landowner, and 3) Recording their response into a geodatabase and creating maps to be used in the field by DNR based on these parcel owners' responses.
Regression Modeling of Landscape Factors on Stream Quality, Spatial Modeling final project at UMD, 2024
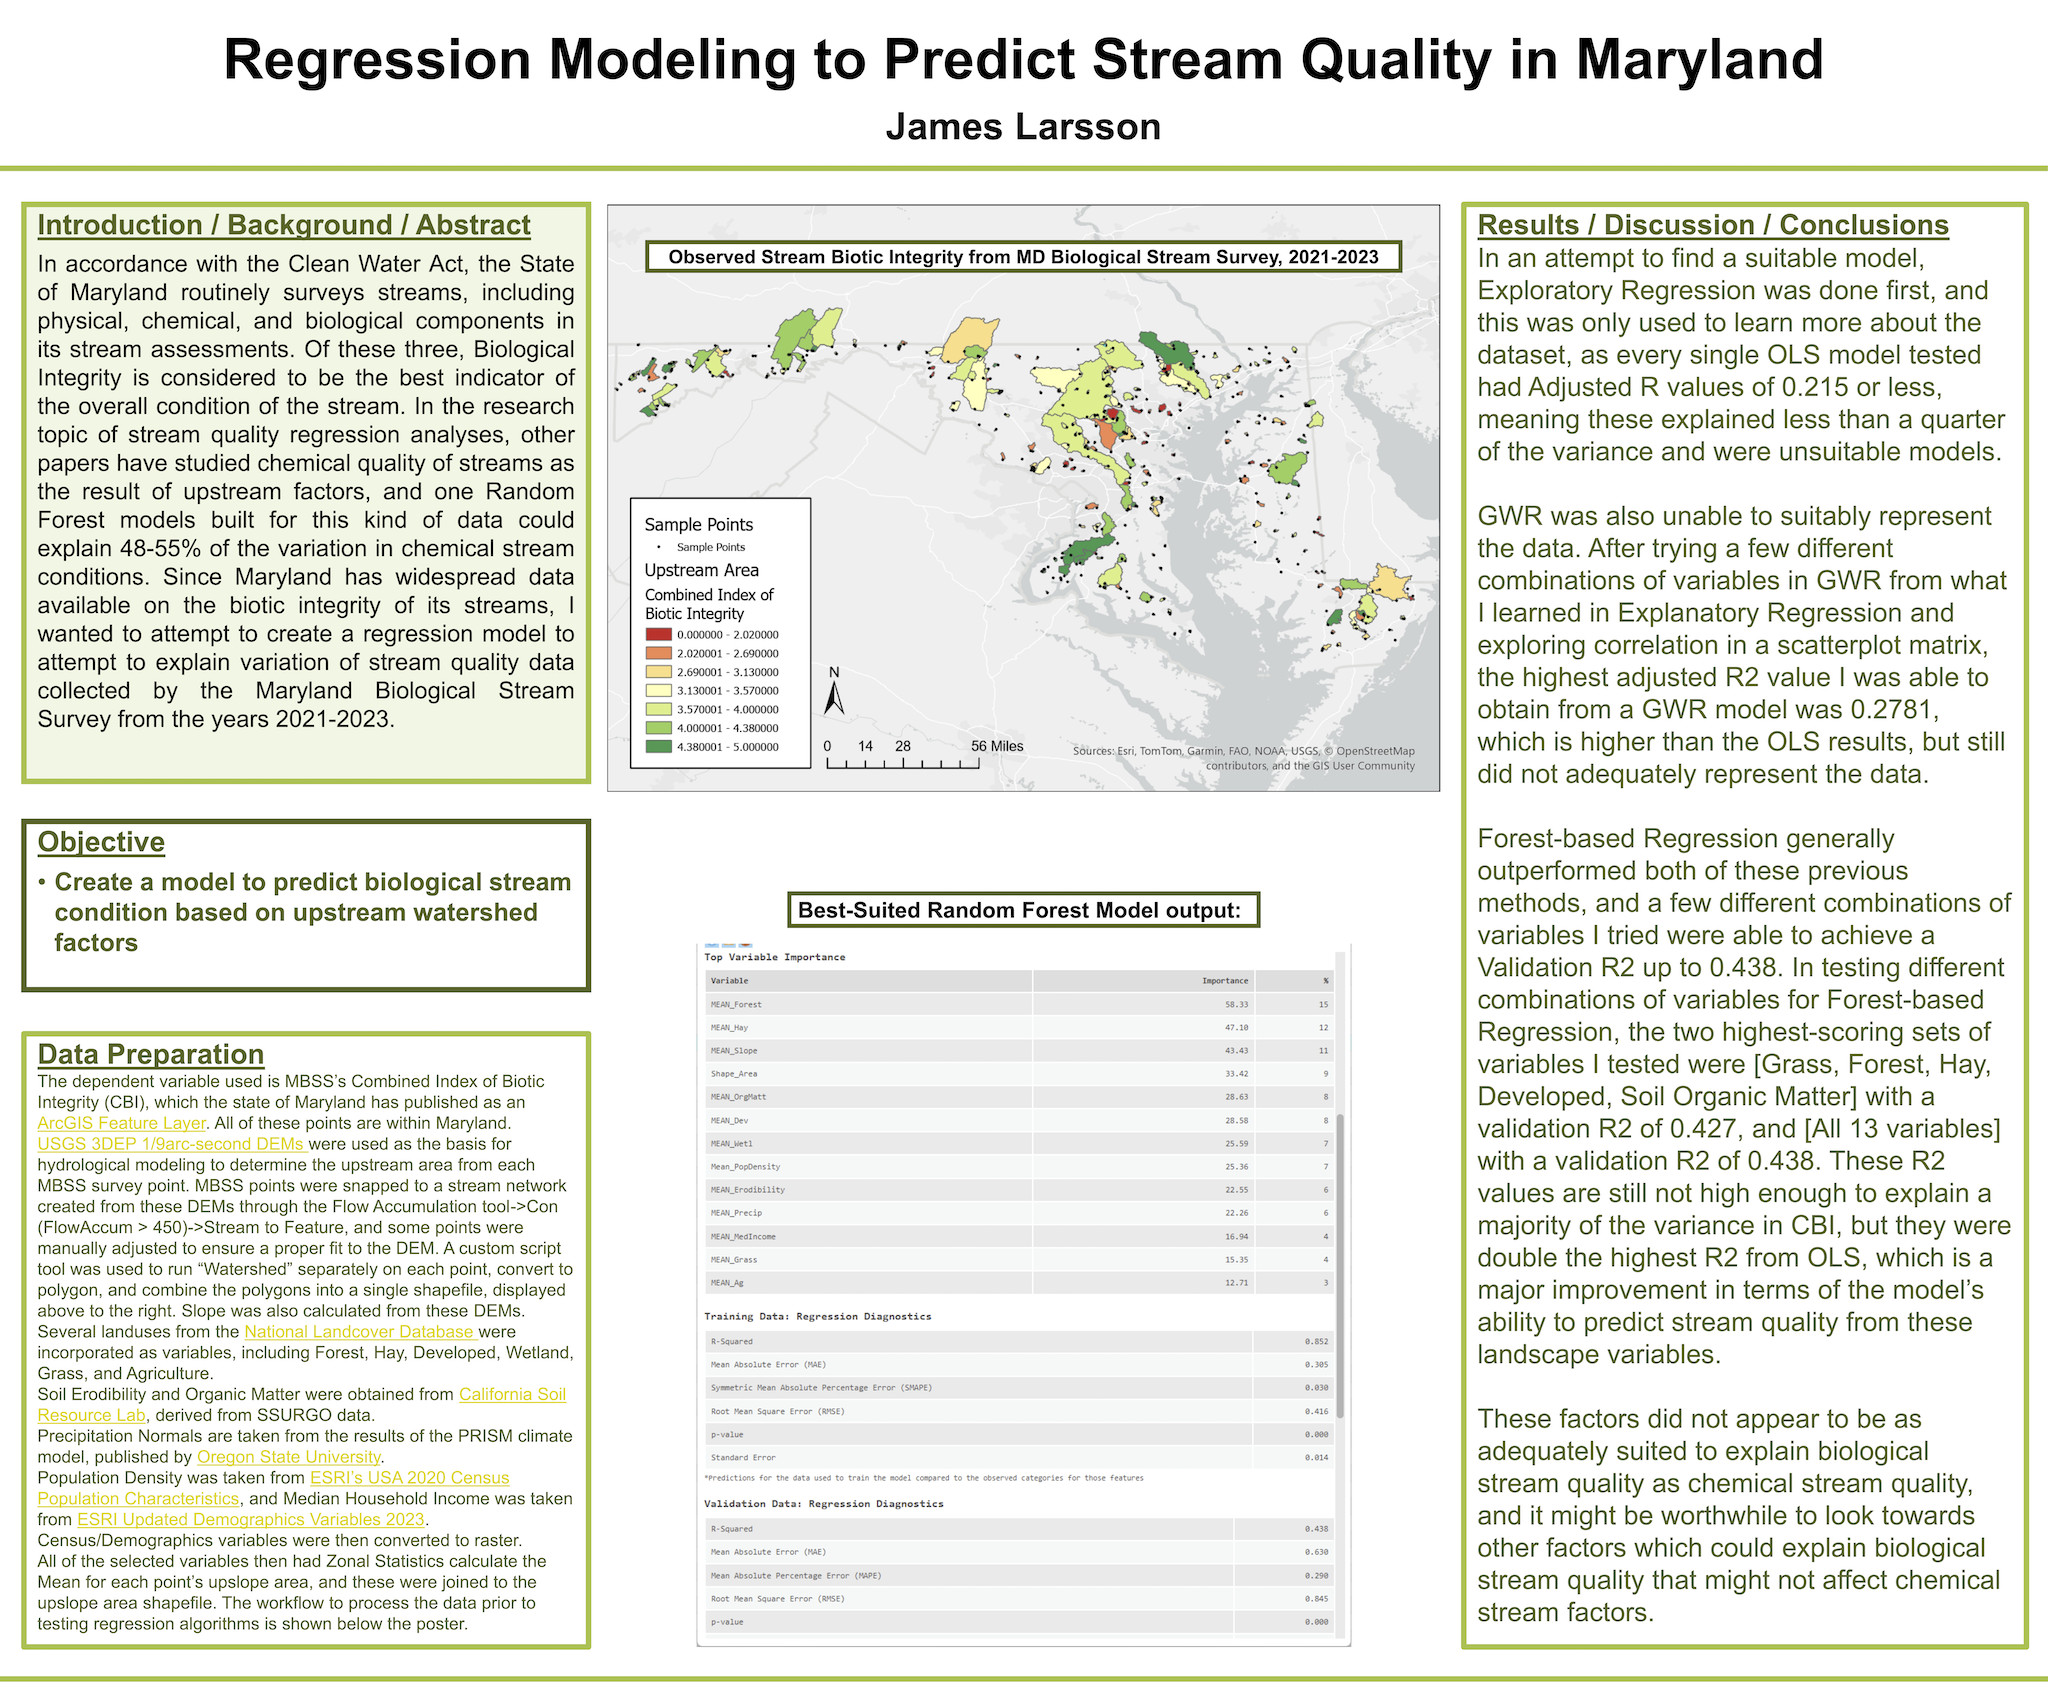
This was my final project for Spatial Modeling in my Master's program at University of Maryland. The model parameters and design were selected from other examples I found in research literature for explaining physical/chemical measures of stream quality, and I wanted to explore whether these same tools could be applied for biological stream quality. This model was carried out using regression tools in ArcGIS Pro, including the Random Forest algorithm. I did extensive data preparation for this analysis, including an ArcGIS Model Builder workflow and a custom Python script to generate watersheds from a set of points and a digital elevation model raster, as no adequate tool for this specific case existed already in ArcGIS Pro. The conclusion of my project was that the factors I had data available for were not able to adequately explain stream biological quality, and that further research would be needed to answer the question I posed.
Suitable Eclipse Viewing Locations, Spatial Analysis final project at UMD, 2024
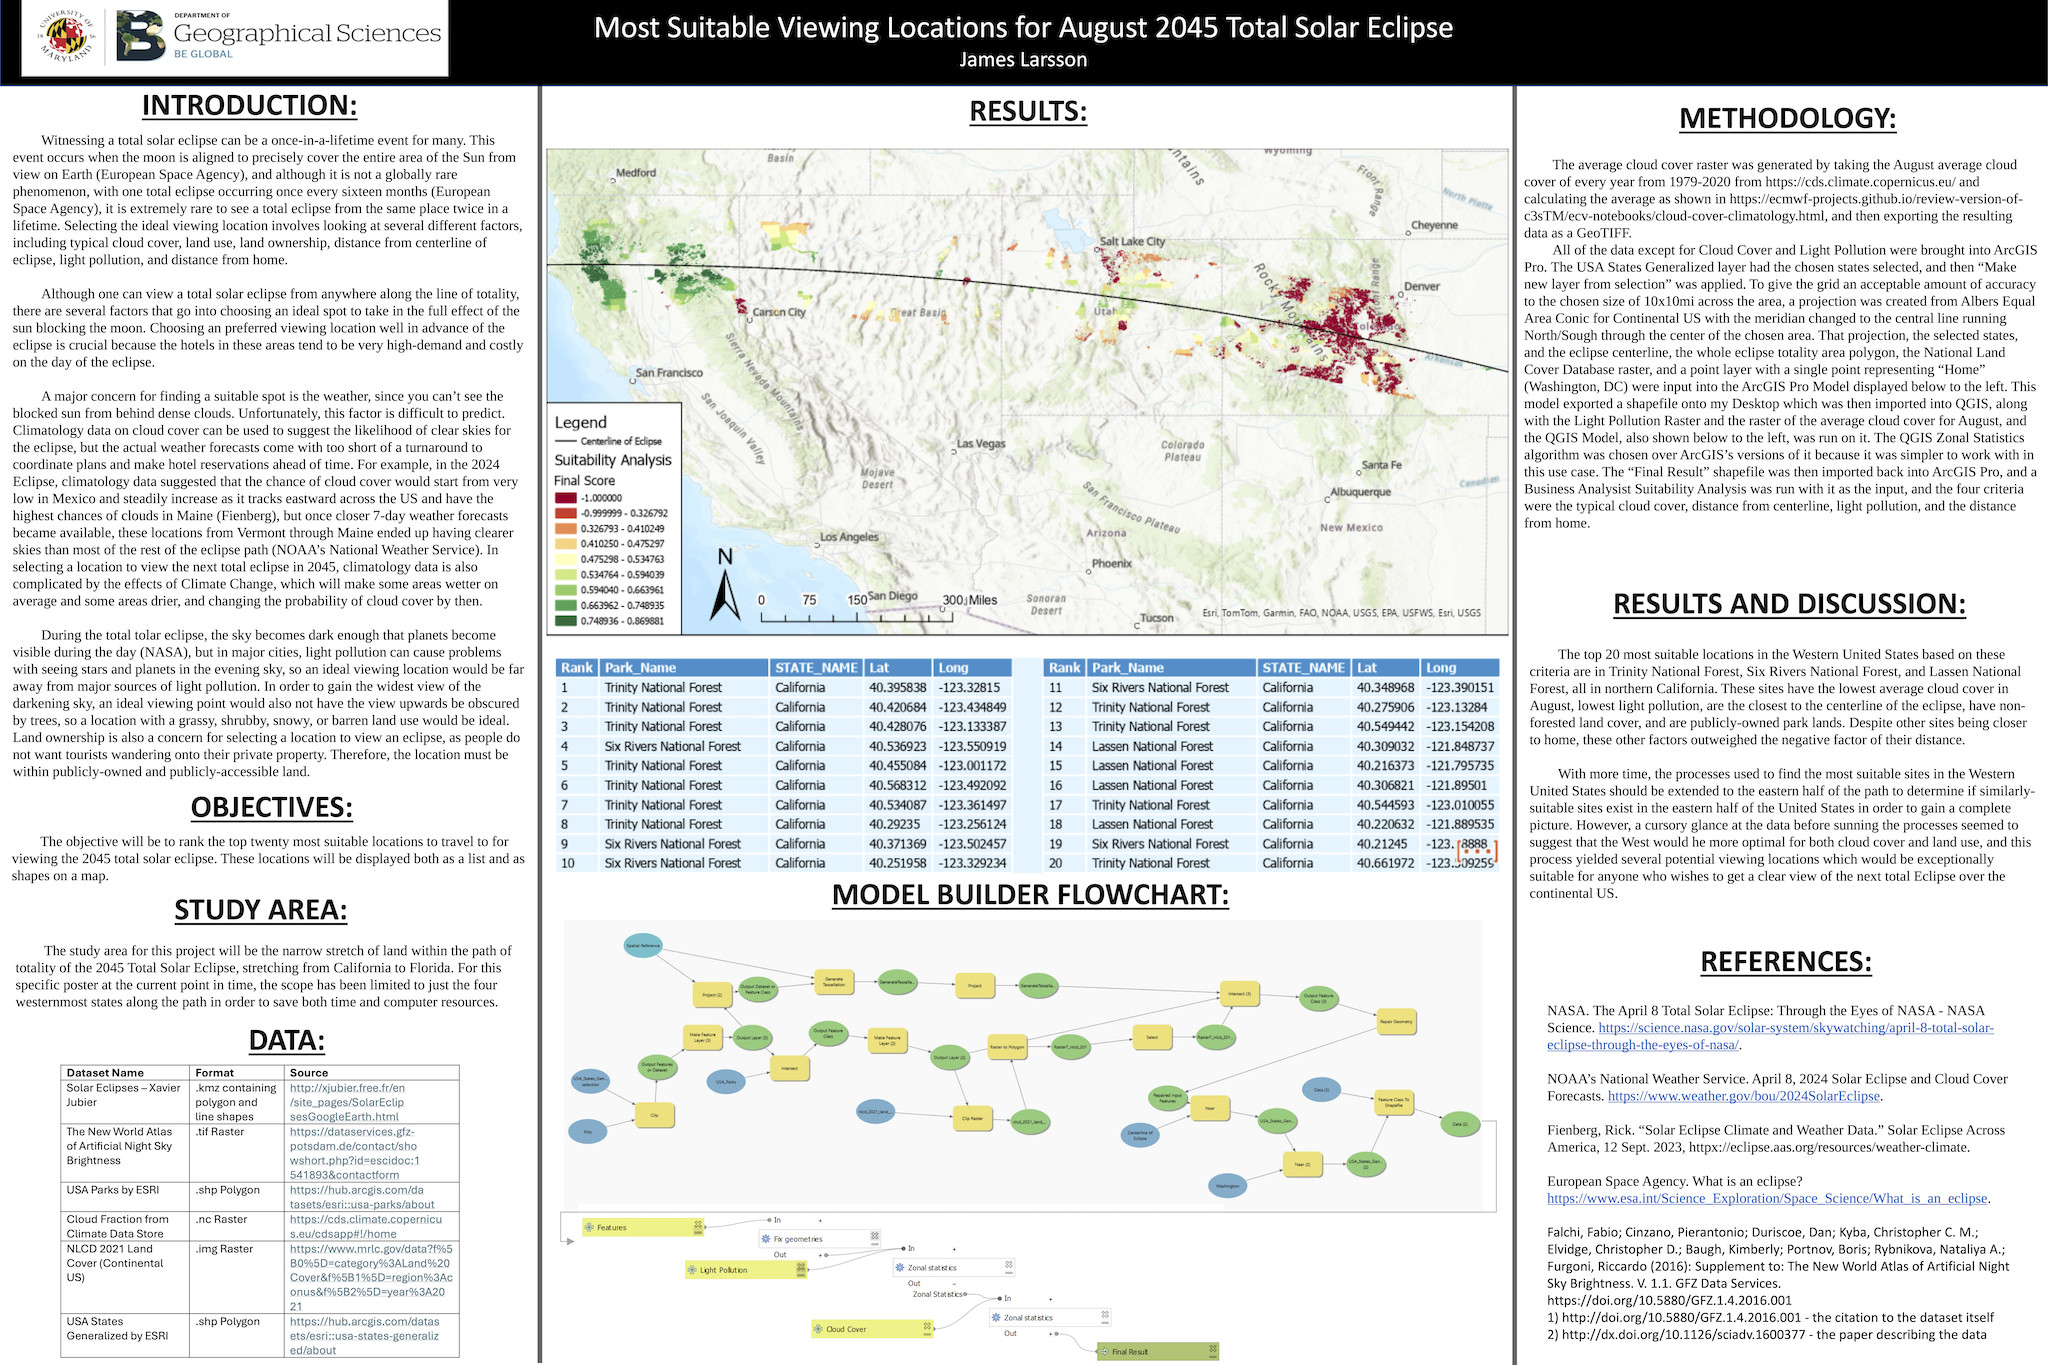
This was my final project for the Spatial Analysis course in my M.S. GIS program. Having recently seen the Total Solar Eclipse of 2024, I had wanted to do my project on a topic related to the next solar eclipse in the US. For my analysis, I considered several different factors, including land use, land ownership, climate patterns, and light pollution, and then ranked the top 20 locations sorted from most suitable to less suitable. My conclusion was that, barring the effects of climate change, Trinity National Forest in Northern California would be the most suitable viewing location by these criteria.
Figure from GES 381 (Remote Sensing) Final Project at UMBC, 2021
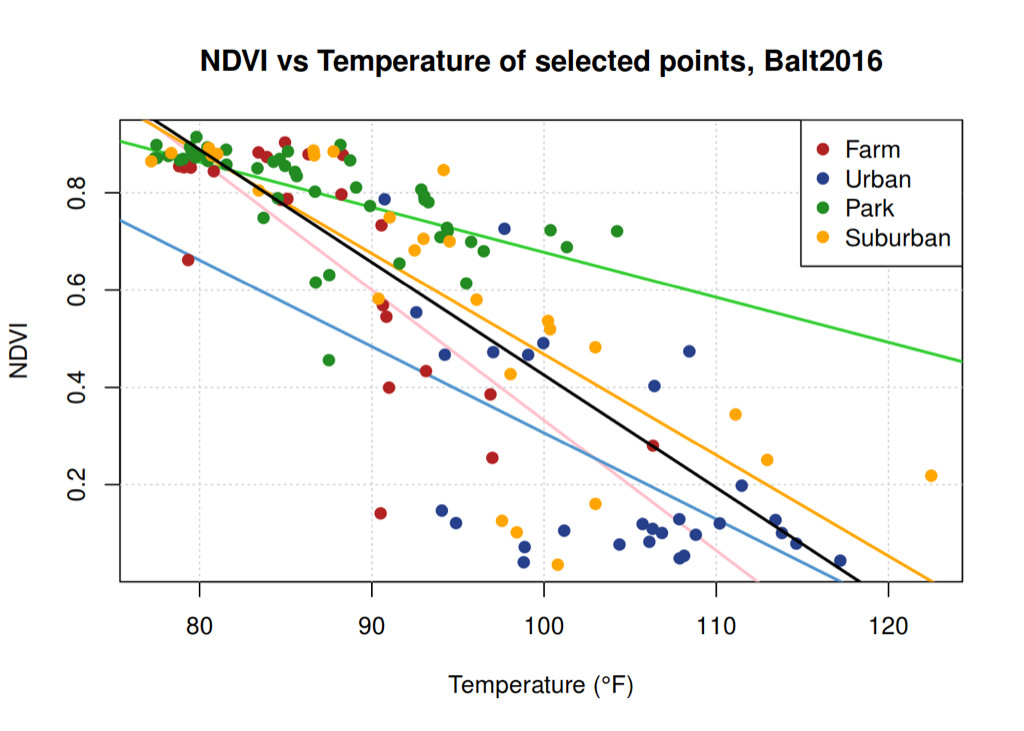
In a project for my undergraduate Remote Sensing course, a partner and I used data from Landsat to explore the relationship between surface temperature and calculated NDVI and IBR indices, in both warmer and cooler years, and classified by Landuse type. Google Earth Engine was used to produce the data, and R was used to analyze and chart it. This chart displays the relationship between NDVI and Temperature in Baltimore in 2016.
Howard County Watersheds (Personal Project), 2021
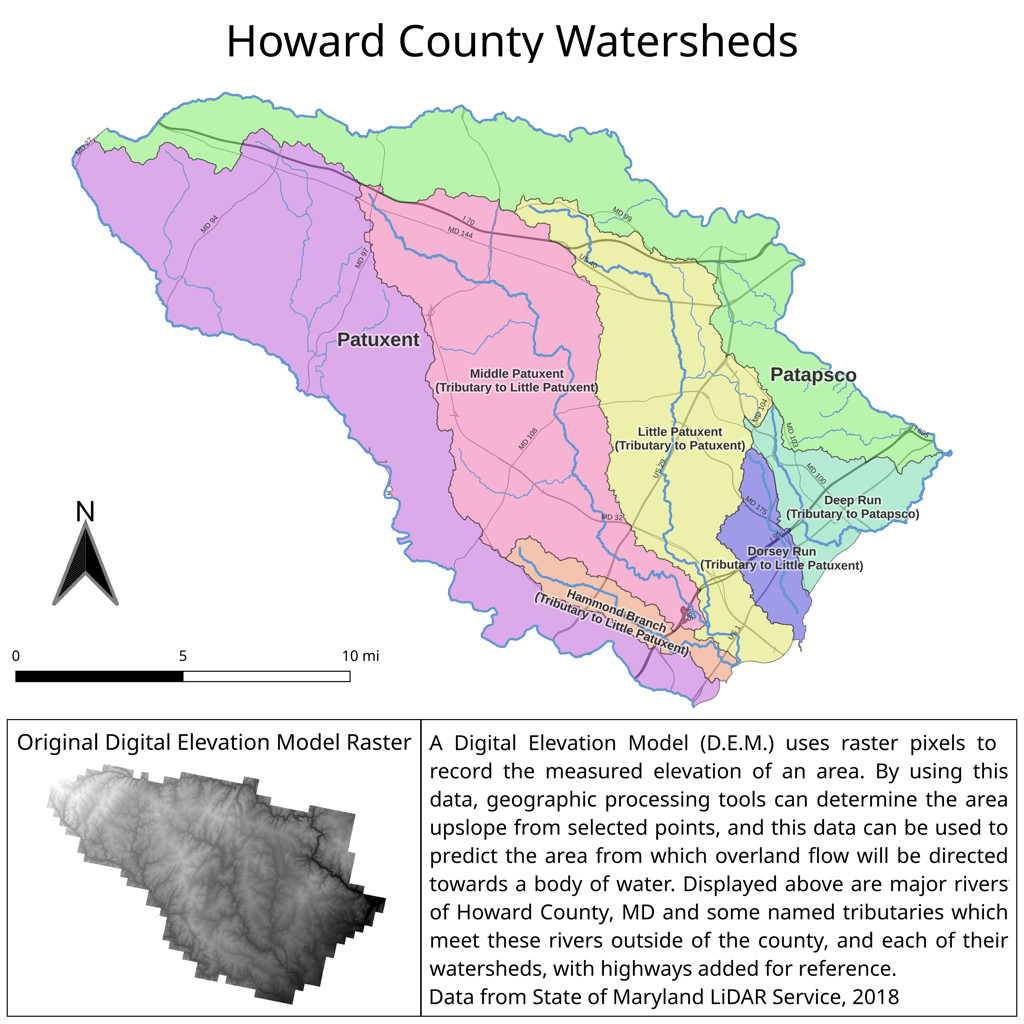
This was a personal project I did between semesters at UMBC. I had wanted to teach myself how to generate watersheds from a Digital Elevation Model raster using open-source SAGA GIS software, and I decided to do so using my home county as an example.
The Shire (Fantasy-style trail map, Personal project), 2021
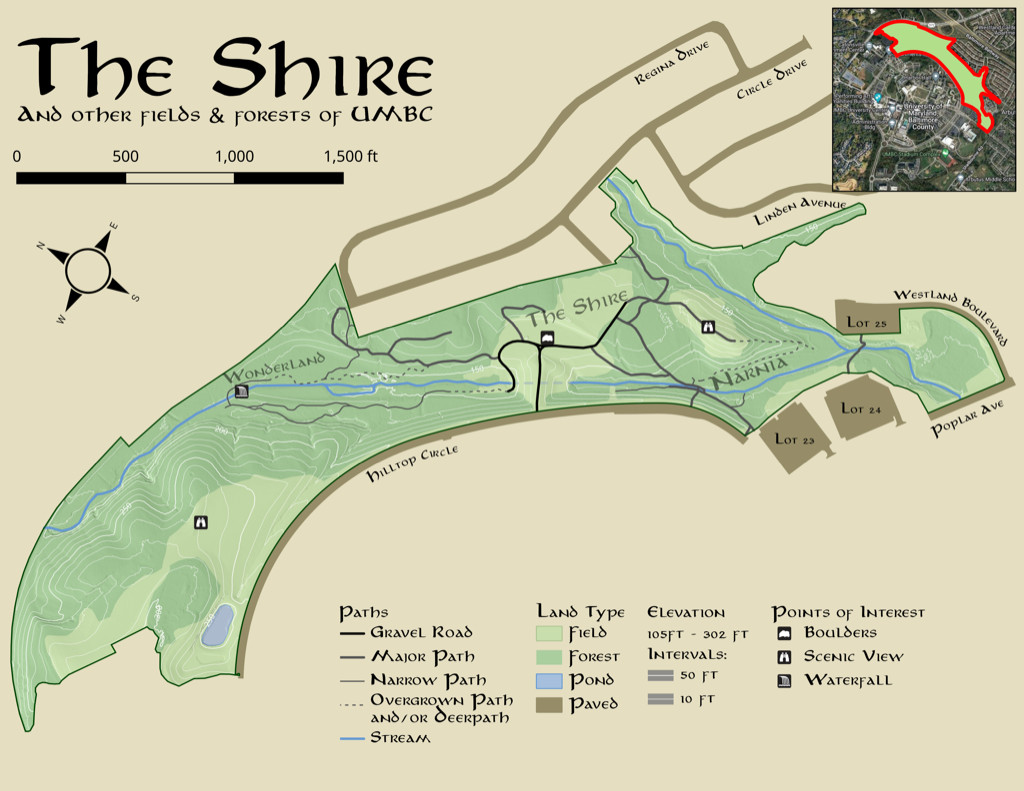
This was a personal project I did between semesters at UMBC. UMBC has some areas on northeast side of campus which other students have informally named after settings from fantasy novels, and none of the small trails linking them had been mapped by any online sources, so I had fun taking a couple hours to trek around the woods on a hot summer day with a Garmin GPSMap in hand, and when I got home, opened up QGIS on my computer and processed all of my GPS tracks into the attached fantasy-style map. This project was purely a creative endeavor, but gave me the opportunity to practice some of the skills I had been picking up in my GIS classes.
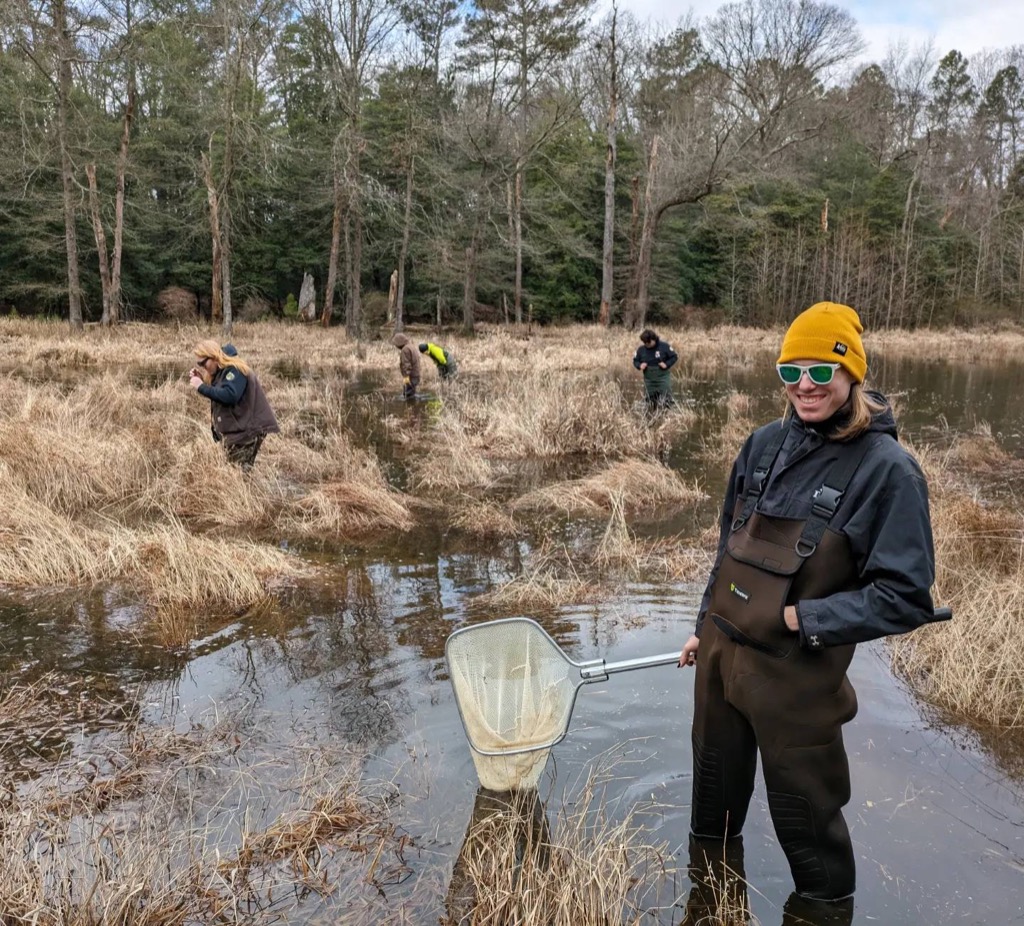
Field Experience Highlights:
All Months
The month slider is a custom tool written in Javascript, and I wrote an additional Python script to create a GeoJSON shapefile using EXIF location tags from a folder of photos. The map is created using the Leaflet.js JavaScript library for online GIS. Click and drag the slider above the map to reveal gallery items from each month! You can view the source code on my GitHub.
Contact Me